School Attainment Data
Please see information below and further links to the School and College Performance Measures Website
St Aldhelms Church School - Compare school and college performance data in England - GOV.UK
KS2 Attainment
KS2 Attainment
2024-2025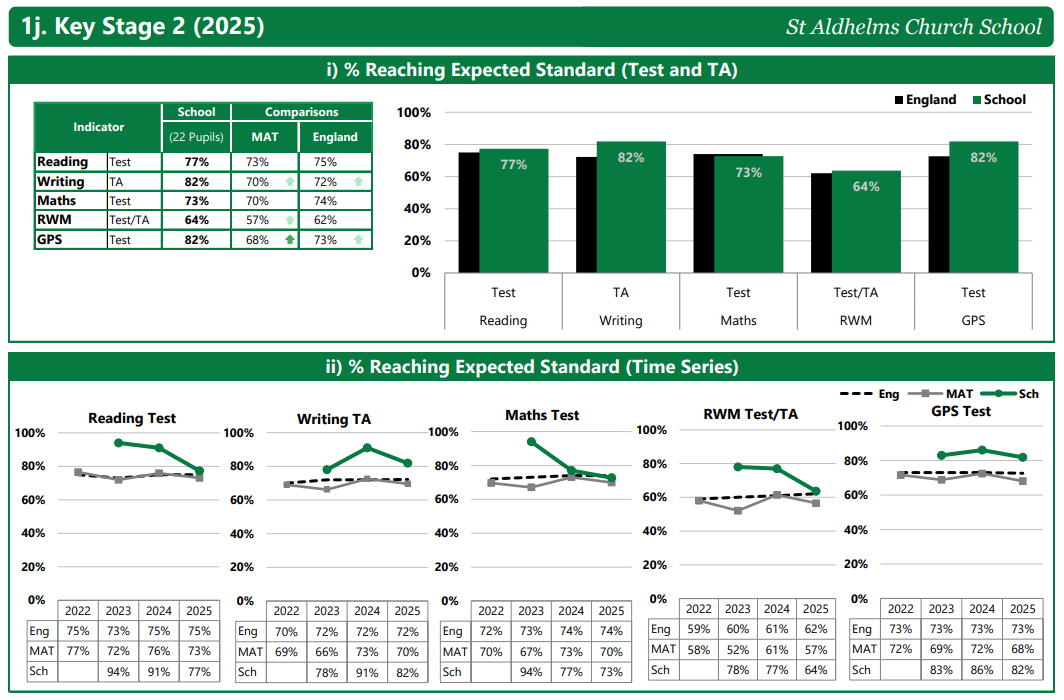
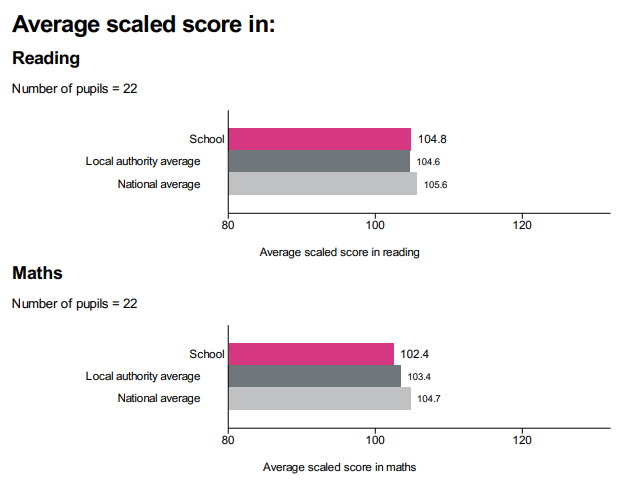
1 Please find a summary of the data for our last two academic years. The analysis of yearly data informs our school development plan by identifying the areas of strength and for improvement.
|
% of cohort meeting expected standard (or above) in each subject |
2022 (19 children) |
2023 (18 children) |
2024 (22 children) |
|---|---|---|---|
|
Reading SCHOOL |
84% |
94% |
91% |
|
Reading National |
75% |
73% |
74% |
|
Writing SCHOOL |
84% |
78% |
77% |
|
Writing National |
69% |
71% |
72% |
|
Mathematics SCHOOL |
68% |
94% |
77% |
|
Mathematics National |
71% |
73% |
73% |
|
Grammar, Punctuation & Spelling SCHOOL |
74% |
83% |
86% |
|
Grammar, Punctuation & Spelling National |
72% |
72% |
72% |
|
Science SCHOOL |
89% |
83% |
91% |
|
Science National |
79% |
80% |
81% |
|
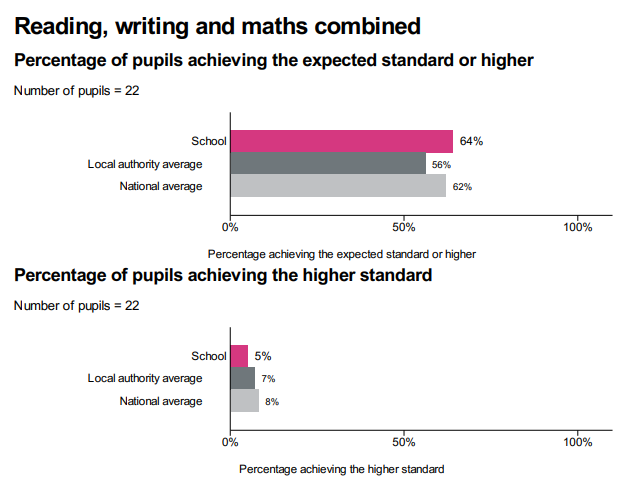
% of cohort meeting expected standard across Reading, Writing and Mathematics |
2022 |
2023 |
2024 |
|---|---|---|---|
|
SCHOOL |
63% |
66% |
77% |
|
National |
59% |
59% |
61% |
|
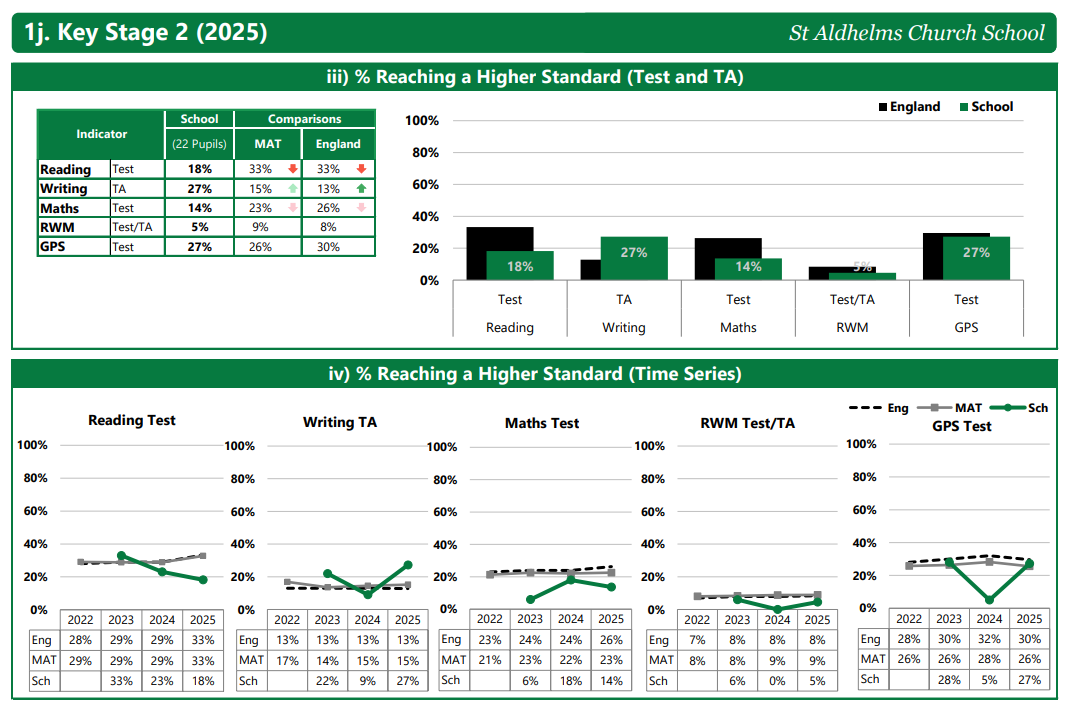
% of cohort working at greater depth /reaching higher standard within the subject |
2022 |
2023 |
2024 |
|---|---|---|---|
|
Reading SCHOOL |
16% |
33% |
23% |
|
Reading National |
|
||
|
Writing SCHOOL |
16% |
22% |
9% |
|
Writing National |
|
||
|
Mathematics SCHOOL |
5% |
6% |
18% |
|
Mathematics National |
|
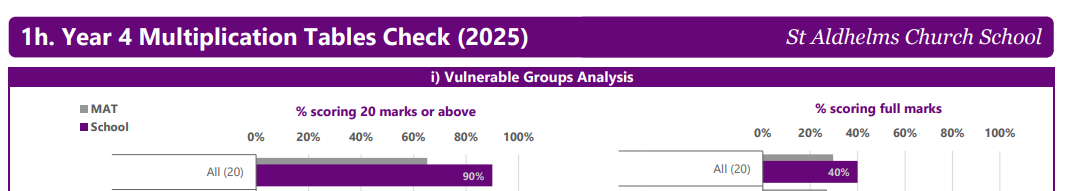
Year 4 Multiplication Tables Check
|
MTC score out of 25 |
2024 |
2025 |
|---|---|---|
|
Children achieving 20 or above |
77% | 90% |
|
Children achieving full marks |
44% | 40% |
In the Multiplication Tables Check for children in Year 4, children complete the check of 25 questions. There is not currently a pass mark threshold, however, we have followed a majority of schools in setting our pass mark at 22.
|
MTC Average Mark |
2024 |
2025 |
|---|---|---|
|
MTC AVERAGE SCHOOL |
21.8 |
22.9 |
| MTC AVERAGE NATIONAL | 20 |
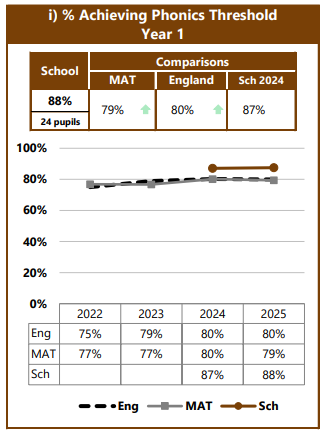
Year One Phonics Screen
|
% Meeting threshold (pass) |
2022 |
2023 |
2024 |
2025 |
|
|---|---|---|---|---|---|
|
School |
100% |
83% |
87% |
88% |
|
|
National |
|
80% |
77% |
80% |
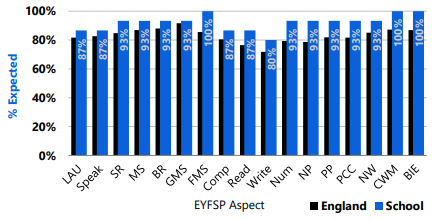
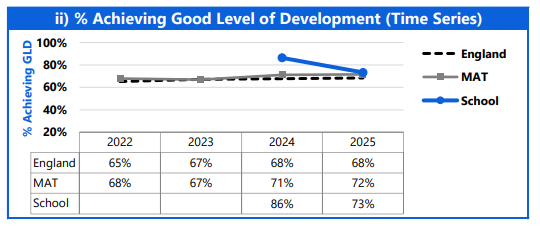
EYFS - GLD
Good level of development (GLD) Children achieving a good level of development are those achieving at least the expected level within the following areas of learning: communication and language; physical development; personal, social and emotional development; literacy; and mathematics.
|
% Achieving GLD |
2022 |
2023 |
2024 |
2025 |
|---|---|---|---|---|
|
School |
80% |
94% |
86% |
73% |
|
National ALL |
65% |
67% |
68% |
68% |